TARGET

Turn off the light when not in use, Keep the future bright. The electric bill won't give you a fright if you remember to turn off the light. Like Money saved is Money earned, Power Saved is Power Generated.

Translate

Popular Posts

Monday 19 August 2019

Boost Charging


Boost Charging:

·         Boost charger is used to charge the battery from zero current to full current. This means the charger supplies, high current to the battery. Example now we need to charge a 12 V 100AH battery means with 200 Amps FLA charger means, the charger delivers maximum allowable current to the battery, hence the battery charges fastly.
·         Charging rate is high, typically full load capacity of the charger,
·         During emergency when A. C. supply fails, the battery shall meet the DC Load. Battery will be discharged after catering the load and it will require boost charging to charge the battery immediately when the battery working on high load requirement.
·         The output voltage is high, since the battery draw high amount of current from the charger.
·         Boost charger ensures that while boost charging if AC supply fails there shall not be any break in DC supply to load. Since this is a No Break Power Supply System.
·         It does not require being in online continuously.

Floating Charger


Floating Charger:

·         Floating Charger is used to maintain the battery voltage. It charges the battery as similar rate of battery discharge. Example now battery is draining two ampere means the charger supplies 2 amperes of current. if the battery voltage is full then the battery stops supplying current. Like that floating charger works. At that same time Float voltage is the voltage at which a battery is maintained after being fully charged to maintain that capacity by compensating for self-discharge of the battery
·         Charging rate is Slow
·         Mainly used to avoid over charging of battery.
·         Battery chargers may stop when the battery is full. A float charger senses when a battery voltage is at the appropriate float level and temporarily ceases charging; it maintains the charge current at zero or a very minimal level until it senses that the battery output voltage has fallen, and then resumes charging
·         The output voltage of the float charging is low as compared with boosting charging.
·         A float charger may be kept connected indefinitely without damaging the battery.
·         It needs soft start arrangement to avoid high initial Float current resulting from restoration of main A.C. supply.
·         It will have separate transformer, rectifier and controls etc.

Float and Boost Charging of Batteries


Float charging is used where the battery rarely gets discharged. A typical application where float charging can be used would consist of the float charger, battery and the load in parallel. During normal operation, the load draws the power from the charger. When the supply to the charger is interrupted, the battery steps in.

Float charging of a battery involves charging the battery at a reduced voltage.  This reduced voltage reduces the possibility of overcharging. The Float charger ensures that the battery is always in the charged condition and is therefore considered "floating".  The Float charger starts by applying a charging voltage to the battery.  As the battery gets charged, its charging current reduces gradually.  The float charger senses the reduction in charging current and reduces the charging voltage.

If the battery gets drained, the float charger will again increase the charging voltage and process continues.  Float chargers can be connected indefinitely to the batteries.

Boost charging involves a high current for short period of time to charge the battery.  It is generally if the battery has been discharged heavily.  Boost charge enables the quick charging of depleted batteries.

Most battery chargers come equipped with provisions for both boost and float charging. 

Battery Performance Characteristics

Battery Performance Characteristics


Specifications, Standards and Hype 
Batteries may be advertised as Long Life, High Capacity, High Energy, Deep Cycle, Heavy Duty, Fast Charge, Quick Charge, Ultra and other, ill defined, parameters and there are few industry or legal standards defining exactly what each of these terms means. Advertising words can mean whatever the seller wants them to mean. Apart from the basic battery design, performance actually depends on how the batteries are used and also on the environmental conditions under which they are used, but these conditions are rarely, if ever, specified in mass market advertising. For the consumer this can be very confusing or misleading. The battery industry itself however does not use such vague terms to specify battery performance and specifications normally include a statement defining or limiting the operating or environmental conditions within which the claimed performance can be delivered.
The following section outlines key parameters used to characterise the cells or batteries and shows how these parameters may vary with the operating conditions.

Discharge Curves

Energy cells have been developed for a wide range of applications using a variety of different technologies, resulting in a wide range of available performance characteristics. The graphs below show some of the main factors an applications engineer should take into account when specifying a battery to match the performance requirements of the end product.

Cell Chemistry

The nominal voltage of a galvanic cell is fixed by the electrochemical characteristics of the active chemicals used in the cell, the so called cell chemistry. The actual voltage appearing at the terminals at any particular time, as with any cell, depends on the load current and the internal impedance of the cell and this varies with, temperature, the state of charge and with the age of the cell.
The graph below shows typical discharge discharge curves for cells using a range of cell chemistries when discharged at 0.2C rate. Note that each cell chemistry has its own characteristic nominal voltage and discharge curve. Some chemistries such as Lithium Ion have a fairly flat discharge curve while others such as Lead acid have a pronounced slope.
The power delivered by cells with a sloping discharge curve falls progressively throughout the discharge cycle. This could give rise to problems for high power applications towards the end of the cycle. For low power applications which need a stable supply voltage, it may be necessary to incorporate a voltage regulator if the slope is too steep. This is not usually an option for high power applications since the losses in the regulator would rob even more power from the battery.
A flat discharge curve simplifies the design of the application in which the battery is used since the supply voltage stays reasonably constant throughout the discharge cycle. A sloping curve facilitates the estimation of the State of Charge of the battery since the cell voltage can be used as a measure of the remaining charge in the cell. Modern Lithium Ion cells have a very flat discharge curve and other methods must be used to determine the State of Charge

Battery Discharge Curves for Different Cell Chemistries

The X axis shows the cell characteristics normalised as a percentage of cell capacity so that the shape of the graph can be shown independent of the actual cell capacity. If the X axis was based on discharge time, the length of each discharge curve would be proportional to the nominal capacity of the cell.

Temperature Characteristics

Cell performance can change dramatically with temperature. At the lower extreme, in batteries with aqueous electrolytes, the electrolyte itself may freeze setting a lower limit on the operating temperature. At low temperatures Lithium batteries suffer from Lithium plating of the anode causing a permanent reduction in capacity. At the upper extreme the active chemicals may break down destroying the battery. In between these limits the cell performance generally improves with temperature. See also Thermal Management and Battery Life for more details.
Battery Discharge performance with Temperature
The above graph shows how the performance of Lithium Ion batteries deteriorates as the operating temperature decreases.
Probably more important is that, for both high and low temperatures, the further the operating temperature is from room temperature the more the cycle life is degraded. See Lithium Battery Failures.

Self Discharge Characteristics

The self discharge rate is a measure of how quickly a cell will lose its energy while sitting on the shelf due to unwanted chemical actions within the cell. The rate depends on the cell chemistry and the temperature.

Cell Chemistry
The following shows the typical shelf life for some primary cells:
  • Zinc Carbon (Leclanché) 2 to 3 years
  • Alkaline 5 years
  • Lithium 10 years or more
Typical self discharge rates for common rechargeable cells are as follows:
  • Lead Acid 4% to 6% per month
  • Nickel Cadmium 15% to 20% per month
  • Nickel Metal Hydride 30% per month
  • Lithium 2% to 3% per month

Temperature Effects
The rate of unwanted chemical reactions which cause internal current leakage between the positive and negative electrodes of the cell, like all chemical reactions, increases with temperature thus increasing the battery self discharge rate. See also Battery Life . The graph below shows typical self discharge rates for a Lithium Ion battery.

Battery Self Discharge with Temperature and Time

Internal Impedance

The internal impedance of a cell determines its current carrying capability. A low internal resistance allows high currents.

Battery Equivalent Circuit
The diagram on the right shows the equivalent circuit for an energy cell.
  • Rm is the resistance of the metallic path through the cell including the terminals, electrodes and inter-connections.
  • Ra is the resistance of the electrochemical path including the electrolyte and the separator.
  • Cb is the capacitance of the parallel plates which form the electrodes of the cell.
  • Ri is the non-linear contact resistance between the plate or electrode and the electrolyte.
Typical internal resistance is in the order of milliohms.

Effects of Internal Impedance
When current flows through the cell there is an IR voltage drop across the internal resistance of the cell which decreases the terminal voltage of the cell during discharge and increases the voltage needed to charge the cell thus reducing its effective capacity as well as decreasing its charge/discharge efficiency. Higher discharge rates give rise to higher internal voltage drops which explains the lower voltage discharge curves at high C rates. See "Discharge Rates" below.

The internal impedance is affected by the physical characteristics of the electrolyte, the smaller the granular size of the electrolyte material the lower the impedance. The grain size is controlled by the cell manufacturer in a milling process.

Spiral construction of the electrodes is often used to maximise the surface area and thus reduce internal impedance. This reduces heat generation and permits faster charge and discharge rates.

The internal resistance of a galvanic cell is temperature dependent, decreasing as the temperature rises due to the increase in electron mobility. The graph below is a typical example.
Lead Acid Battery Resistance Change with Temperature
Thus the cell may be very inefficient at low temperatures but the efficiency improves at higher temperatures due to the lower internal impedance, but also to the increased rate of the chemical reactions. However the lower internal resistance unfortunately also causes the self discharge rate to increase. Furthermore, cycle life deteriorates at high temperatures. Some form of heating and cooling may be required to maintain the cell within a restricted temperature range to achieve the optimum performance in high power applications.

The internal resistance of most cell chemistries also tends to increase significantly towards the end of the discharge cycle as the active chemicals are converted to their discharged state and hence are effectively used up. This is principally responsible for the rapid drop off in cell voltage at the end of the discharge cycle.

In addition the Joule heating effect of the I2R losses in the internal resistance of the cell will cause the temperature of the cell to rise.

The voltage drop and the I2R losses may not be significant for a 1000 mAh cell powering a mobile phone but for a 100 cell 200 Ah automotive battery they can be substantial. Typical internal resistance for a 1000mA Lithium mobile phone battery is around 100 to 200mOhm and around 1mOhm for a 200Ah Lithium cell used in an automotive battery. See example.

Operating at the C rate the voltage drop per cell will be about 0.2 volts in both cases, (slightly less for the mobile phone). The I2R loss in the mobile phone will be between 0.1 and 0.2 Watts. In the automotive battery however the voltage drop across the whole battery will be 20 Volts and I2R power loss dissipated as heat within the battery will be 40 Watts per cell or 4KW for the whole battery. This is in addition to the heat generated by the electrochemical reactions in the cells.

As a cell ages, the resistance of the electrolyte tends to increase. Aging also causes the surface of the electrodes to deteriorate and the contact resistance builds up and at the same the effective area of the plates decreases reducing its capacitance. All of these effects increase the internal impedance of the cell adversely affecting its ability to perform. Comparing the actual impedance of a cell with its impedance when it was new can be used to give a measure or representation of the age of a cell or its effective capacity. Such measurements are much more convenient than actually discharging the cell and can be taken without destroying the cell under test. See "Impedance and Conductance Testing"

The internal resistance also influences the effective capacity of a cell. The higher the internal resistance, the higher the losses while charging and discharging, especially at higher currents. This means that for high discharge rates the lower the available capacity of the cell. Conversely, if it is discharged over a prolonged period, the AmpHour capacity is higher. This is important because some manufacturers specify the capacity of their batteries at very low discharge rates which makes them look a lot better than they really are.

Discharge Rates

The discharge curves for a Lithium Ion cell below show that the effective capacity of the cell is reduced if the cell is discharged at very high rates (or conversely increased with low discharge rates). This is called the capacity offset and the effect is common to most cell chemistries.
Battery Capacity Change with Discharge Rate (C-Rate)

Battery Load
Battery discharge performance depends on the load the battery has to supply.
If the discharge takes place over a long period of several hours as with some high rate applications such as electric vehicles, the effective capacity of the battery can be as much as double the specified capacity at the C rate. This can be most important when dimensioning an expensive battery for high power use. The capacity of low power, consumer electronics batteries is normally specified for discharge at the C rate whereas the SAE uses the discharge over a period of 20 hours (0.05C) as the standard condition for measuring the Amphour capacity of automotive batteries. The graph below shows that the effective capacity of a deep discharge lead acid battery is almost doubled as the discharge rate is reduced from 1.0C to 0.05C. For discharge times less than one hour (High C rates) the effective capacity falls off dramatically.
The effectiveness of charging is similarly influenced by the rate of charge. An explanation of the reasons for this is given in the section on Charging Times .


Battery Capacity vs Discharge Rate or Time
There are two conclusions to be drawn from this graph:
  • Care should be exercised when comparing battery capacity specifications to ensure that comparable discharge rates are used.
  • In an automotive application, if high current rates are used regularly for hard acceleration or for hill climbing, the range of the vehicle will be reduced.

Duty Cycle
Duty cycles are different for each application. EV and HEV appications impose particular, variable loads on the battery. See Load Testing example. Stationary batteries used in distributed grid energy storage applications may have very large SOC changes and many cycles per day.
It is important to know how much energy is used per cycle and to design for the maximum energy throughput and power delivery, not the average.

Notes: For information
  • A typical small electric car will use between 150 to 250 Watthours of energy per mile with normal driving. Thus, for a range of 100 miles at 200 Watthours per mile, a battery capacity of 20 KWh will be required.
  • Hybrid electric vehicle use smaller batteries but they may be required to operate at very high discharge rates of up to 40C. If the vehicle uses regenerative braking the battery must also accept very high charging rates to be effective. See the section about Capacitors for an example of how this requirement can be accommodated.

Peukert Equation
The Peukert equation is a convenient way of characterising cell behaviour and of quantifying the capacity offset in mathematical terms.
This is an empirical formula which approximates how the available capacity of a battery changes according to the rate of discharge. C = I n  T where "C" is the theoretical capacity of the battery expressed in amp hours, "I" is the current, "T" is time, and "n" is the Peukert Number, a constant for the given battery. The equation shows that at higher currents, there is less available energy in the battery. The Peukert Number is directly related to the internal resistance of the battery. Higher currents mean more losses and less available capacity.
The value of the Peukert number indicates how well a battery performs under continuous heavy currents. A value close to 1 indicates that the battery performs well; the higher the number, the more capacity is lost when the battery is discharged at high currents. The Peukert number of a battery is determined empirically. For Lead acid batteries the number is typically between 1.3 and 1.4

Peukert Curve for Battery Discharge Capacity
The graph above shows that the effective battery capacity is reduced at very high continuous discharge rates. However with intermittent use the battery has time to recover during quiescent periods when the temperature will also return towards the ambient level. Because of this potential for recovery, the capacity reduction is less and the operating efficiency is greater if the battery is used intermittently as shown by the dotted line.
This is the reverse of the behaviour of an internal combustion engine which operates most efficiently with continuous steady loads. In this respect electric power is a better solution for delivery vehicles which are subject to continuous interruptions.

Ragone Plots

The Ragone plot is useful for characterising the trade-off between effective capacity and power handling. Note that the Ragone plots are usually based on logarithmic scales.
The graph below shows the superior gravimetric energy density of Lithium Ion cells. Note also that Lithium ion cells with Lithium Titanate anodes (Altairnano) deliver a very high power density but a ruduced energy density.

Energy and Power Density - Ragone Plot

Ragone Plot - Energy and Power Density of Lithium Battery Cells

The Ragone plot below compares the performance of a range of electrochemical devices. It shows that ultracapacitors (supercapacitors) can deliver very high power but the storage capacity is very limited. On the other hand Fuel Cells can store large amounts of energy but have a relatively low power output.

Ragone Plot of Electrochemical Devices

Ragone Plot of Alternative Energy Storage Devices

The sloping lines on the Ragone plots indicate the relative time to get the charge in or out of the device. At one extreme, power can be pumped into, or extracted from, capacitors in microseconds. This makes them ideal for capturing regenerative braking energy in EV applications. At the other extreme, fuel cells have a very poor dynamic performance taking hours to generate and deliver their energy. This limits their application in EV applications where they are often used in conjunction with batteries or capacitors to overcome this problem. Lithium batteries are somewhere in between and provide a reasonable compromise between the two.


Pulse Performance

The ability to deliver high current pulses is a requirement of many batteries. The current carrying capacity of a cell depends on the effective surface area of the electrodes. (See Energy/Power Trade-Offs). The current limit is however set by the rate at which the chemical reactions occur within the cell. The chemical reaction or "charge transfer" takes place on the surface of the electrodes and the initial rate can be quite high as the chemicals close to the electrodes are transformed. Once this has occurred however, the reaction rate becomes limited by the rate at which the active chemicals on the electrode surface can be replenished by diffusion through the electrolyte in a process known as "mass transfer". The same principle applies to the charging process and is explained in more detail in the section on Charging Times. The pulse current can therefore be substantially higher than the C rate which characterises the continuous current performance.

Cycle Life

This is one of the key cell performance parameters and gives an indication of the expected working lifetime of the cell.

battery Cycle Life Definition

The cycle life is defined as the number of cycles a cell can perform before its capacity drops to 80% of its initial specified capacity.
Each charge - discharge cycle, and the associated transformation cycle of the active chemicals it brings about, is accompanied by a slow deterioration of the chemicals in the cell which will be almost imperceptible to the user. This deterioration may be the result of unavoidable, unwanted chemical actions in the cell or crystal or dendrite growth changing the morphology of the particles making up the electrodes. Both of these events may have the effect of reducing the volume of the active chemicals in the cell, and hence its capacity, or of increasing the cell's internal impedance.
Note that the cell does not die suddenly at the end of the specified cycle life but continues its slow deterioration so that it continues to function normally except that its capacity will be significantly less than it was when it was new.

The cycle life as defined is a useful way of comparing batteries under controlled conditions, however it may not give the best indication of battery life under actual operating conditions. Cells are seldom operated under successive, complete charge - discharge cycles, they are much more likely to be subject to partial discharges of varying depth before complete recharging. Since smaller amounts of energy are involved in partial discharges, the battery can sustain a much greater number of shallow cycles. Such usage cycles are typical for Hybrid Electric Vehicle applications with regenerative braking. See how cycle life varies with depth of discharge (DOD) in Battery Life.

Cycle life also depends on temperature, both operating and storage temperature. See more details in the section on Lithium Battery Failures.

Total Energy Throughput
A more representative measure of battery life is the Lifetime Energy Throughput. This is the total amount of energy in Watthours which can be put into and taken out of a battery over all the cycles in its lifetime before its capacity reduces to 80% of its initial capacity when new. It depends on the cell chemistry and the operating conditions. Unfortunately this measure is not yet in common use by cell manufacturers and has not yet been adopted as a battery industry standard. Until it comes into general use it will not be possible to use it to compare the performance of cells from different manufacturers in this way but, when available, at least it provides a more useful guide to applications engineers for estimating the useful life of batteries used in their designs.


Deep Discharge

Cycle life decreases with increased Depth of Discharge (DOD) (See Battery Life) and many cell chemistries will not tolerate deep discharge and cells may be permanently damaged if fully discharged. Special cell constructions and chemical mixes are required to maximise the potential DOD of deep cycle batteries.


Charging Characteristics


Charging curves and recommended charging methods are included in a separate section on Charging

Battery Testing

Testing is designed to tell us things we want to know about individual cells and batteries.
Some typical questions are:
  • Is it fully charged ?
  • How much charge is left in the battery ?
  • Does it meet the manufacturer's specification ?
  • Has there been any deterioration in performance since it was new ?
  • How long will it last ?
  • Do the safety devices all work ?
  • Does it generate interference or electrical noise ?
  • Is it affected by interference or electrical noise ?

The answers are not always straightforward.

Indirect Measurements
Although all of the cell parameters the design engineer may wish to measure can be quantified by direct measurement, this is not always convenient or possible . For example the amount of charge left in the battery, the State of Charge (SOC) can be determined by fully discharging the battery and measuring the energy output. This takes time, it wastes energy, each test cycle shortens the battery life and it may not be practical if the battery is in use. It would also be pointless for a primary cell. For more detailed information of how this is done see the State of Charge page.
Similarly, the remaining life of a secondary cell can be determined by continuously cycling it until it fails, but there's no point in knowing the cell life expectation if you have to destroy it to find out. This is known as the State of Health (SOH) of the battery.
What is needed are simple tests or measurements which can be used as an approximation to, or indirect measure of, the desired parameter. For more information see the State of Health page

The Cell Design Process Testing

A much more detailed testing regime is necessary in the design of new cells. More information can be found on the New Battery Designs and Chemistries page.

Test Conditions

In all of the following tests, and testing in general, the test conditions must be specified so that repeatable results can be obtained, and meaningful comparisons can be made. This includes factors such as method, temperature, DOD, load and duty cycle. For instance the cell capacity and cycle life, two key performance indicators could vary by 50% or more depending on the temperature and the discharge rate at which the tests were carried out. See also cell Performance Characteristics.

Battery specifications should always include the test conditions to avoid ambiguity.

Qualification Testing

Qualification testing is designed to determine whether a cell or battery is fit for the purpose for which it was intended before it is approved for use in the product. This is particularly important if the cell is to be used in a "mission critical" application. These are comprehensive tests carried out initially on a small number of cells including testing some of them to destruction if necessary. As a second stage, qualification also includes testing finished battery packs before the product is approved for release to the customer. The tests are usually carried out to verify that the cells meet the manufacturer's specification but they could also be used to test the cells to arbitrary limits set by the applications engineer to determine how long the cells survive under adverse conditions or unusual loads, to determine failure modes or safety factors.

The battery packs should also be tested with the charger recommended for the application to ensure compatibility. In particular the potential user patterns must be evaluated to ensure that the batteries do not become inadvertently overcharged. See also the section on Chargers.

Shake and Bake
  • Mechanical Testing
  • Typical tests are included in the safety standards below. They include simple tests for dimensional accuracy to dynamic testing to verify that the product can survive any static and dynamic mechanical stresses to which it may be subject.

  • Environmental Testing
  • Typical tests are included in the safety standards below. They are designed to exercise the product through all the environmental conditions likely to be encountered by the product during its lifetime.

Abuse Testing
The purpose of abuse testing is to verify that the battery is not a danger to the user or to itself either by accidental or deliberate abuse under any conceivable conditions of use. Designing foolproof batteries is ever more difficult because as we know, fools are so ingenious.
Abuse testing (always interesting to witness) is usually specified as part of the Safety Testing (below). Recent accidents with Lithium cells have highlighted the potential dangers and stricter battery design rules and a wider range of tests are being applied as well as stricter Transport Regulationsfor shipping the products.

Safety Standards
Consumer products normally have to comply with national or international Safety Standards required by the safety organisations of the countries in which the products are sold. Examples are UL, ANSI, CSA and IEC standards.

Typical contents

Safety Tests

Casing
  • Strength, rigidity and flammability
  • Mould stress (Temperature)
  • Venting
  • Insulation
  • Electrolyte not under pressure
  • No leakage
  • No explosion or fire risk

Protection from or tolerance to
  • Short circuit
  • Overcharge (time)
  • Overcharge (voltage)
  • Over-discharge
  • Voltage reversal
  • High temperature
  • Low temperature
  • Misuse
  • Abuse

Power output - Load test
Failsafe electronics

Marking
Instructions for use
Safety instructions

Mechanical tests
  • Crush tests
  • Nail penetration tests
  • Shock test
  • Vibration test
  • Impact test
  • Drop test

Environmental tests
  • Heating
  • Temperature cycling
  • Altitude
  • Humidity
  • Exposure to fire

The published safety standards specify the method of testing and the limits with which the product must comply.

DEF Standards
Cells used in military applications usually have to meet more stringent requirements than those used in consumer products.

Cycle Testing
This is perhaps the most important of the qualification tests. Cells are subjected to repeated charge - discharge cycles to verify that the cells meet or exceed the manufacturer's claimed cycle life. Cycle life is usually defined as the number of charge - discharge cycles a battery can perform before its nominal capacity falls below 80% of its initial rated capacity. These tests are needed to verify that the battery performance is in line with the end product reliability and lifetime expectations and will not result in excessive guarantee or warranty claims.

Temperature, charge/discharge rates and the Depth of Discharge each have a major influence on the cycle life of the cells (See the page on Cycle Life) Depending on the purpose of the tests, the temperature and the DOD should be controlled at an agreed reference level in order to have repeatable results which can be compared with a standard. Alternatively the tests can be used to simulate operating conditions in which the temperature is allowed to rise, or the DOD restricted, to determine how the cycle life will be affected.

Similarly cycle life is affected by over charging and over discharging and it is vital to set the correct voltage and current limits if the manufacturer's specification is to be verified.

Cycle testing is usually carried out banks of cells using multi channel testers which can create different charge and discharge profiles including pulsed inputs and loads. At the same time various cell performance parameters such as temperature, capacity, impedance, power output and discharge time can be monitored and recorded. Typically it takes about 5 hours for a controlled full charge discharge cycle. This means testing to 1000 cycles will take 208 days assuming working 7 days per week 24 hours per day. Thus it takes a long time to verify the effect of any ongoing improvements made to the cells. Because the ageing process is continuous and fairly linear, it is possible to predict the lifetime of a cell from a smaller number of cycles. However to prove it conclusively in order to guarantee a product lifetime would require a large number of cells and a long time. For high power batteries this could be very expensive.


Load Testing
Load testing is used to verify that the battery can deliver its specified power when needed.
The load is usually designed to be representative of the expected conditions in which the battery may be used. It may be a constant load at the C rate or pulsed loads at higher current rates or in the case of automotive batteries, the load may be designed to simulate a typical driving pattern. Low power testing is usually carried out with resistive loads. For very high power testing with variable loads other techniques may be required. A Ward-Leonard controller may be used to provide the variable load profile with the battery power being returned to the mains supply rather than being dissipated in a load.

Note that the battery may appear to have a greater capacity when it is discharged intermittently than it may have when it is discharged continuously. This is because the battery is able to recover during the idle periods between heavy intermittent current drains. Thus testing a battery capacity with a continuous high current drain will not necessarily give results which represent the capacity achievable with the actual usage profile.

Load testing is often required to be carried out with variable load levels. This may simply be pulsed loads or it could be more complex high power load profiles such as those required for electric vehicle batteries. Standard load profiles such as the Federal Urban Driving Schedule (FUDS) and the Dynamic Stress Test (DST) specified by the United Sates Advanced Battery Consortium (USABC), in the USA, and the United Nations Economic Commission for Europe specification (ECE-15) and the Extra Urban Driving Cycle (EUDC) in Europe have been developed to simulate driving conditions and several manufacturers have incorporated these profiles into their test equipment.

Standard Automotive Driving Cycle
ECE-15 Simulated Driving Cycle

While these standard usage cycles have been developed to provide a basis for comparison, it should be noted that the typical user doesn't necessarily drive according to these cycles and is likely to accelerate at least twice as fast as the allowed for in the standards.

Calorimetry
Battery thermal management is critical for high-power battery packs. Obtaining accurate heat generation data from battery modules is essential for designing battery thermal management systems. A calorimeter is used to quantify the total amount of heat generated by the battery while it is cycled through its charge/discharge cycles. This is essentially an insulated box into which the battery is placed which captures and measures the heat generated the battery during cycling. The system is calibrated by comparing the heat generated by the battery with the heat generated by a known heat source.

Thermal imaging
Thermal image Showing Heat Distribution
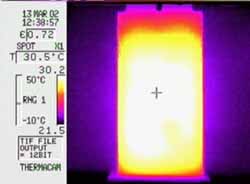
Thermal imaging is used to check for "hot spots" which would indicate points of high thermal stress in the cell or the battery pack. It is a photographic technique which records the intensity of the infra red radiation emitted by a subject using a special camera. The image on the left is of a lithium ion pouch cell after a prolonged discharge at 4C. In this case the temperature is evenly distributed within the cell and the cell terminals are running cool. These tests can help to identify problems such as overheating, inadequate heat sinking or air flow, undersized current conductors and interference from neighbouring cells or devices. The images can also be used to determine the best location for the temperature sensors used in protection circuits.

Electromagnetic Compatibility (EMC) testing
Electromagnetic compatibility (EMC) is the ability of electronic and electrical equipment and systems to operate without adversely affecting other electrical or electronic equipment OR being affected by other sources of interference such as power line transients, radio frequency (RF) signals, digital pulses, electrical machinery, lightning, or other influences.
Note that EMC concerns both the emission of electromagnetic interference (EMI or radio frequency interference RFI) by a product or device and the product's susceptibility to EMI emitted from other sources. The interference may be conducted through power or signal cables or the chassis of the equipment, it may be propagated through inductive or capacitive coupling or it may be radiated through the atmosphere.

Just because batteries are DC devices we can not assume that they are immune from EMC problems. At MPower we have seen the battery protection circuitry in a two way radio disabled by RF interference from the handset's transmitter. Similar problems are possible in automotive applications where the power cabling is notoriously noisy due to interference from the ignition systems and transients from electric motors and switches. While the battery itself may not emit RF interference, the same can not be said of the charger. Many chargers use switch mode regulators which are also notorious for emitting electrical noise. Radiated EMI can be critical to such applications as heart pacemakers, medical instrumentation, communications equipment and military applications.

As with many problems prevention is better than cure and it is wise to start considering EMC at the earliest possible stage of the design to avoid costly design changes when the project is submitted for final approval. This may involve system design choices such as operating frequencies, circuit layouts and enclosure design and the avoidance of designs with high transient currents.
Various techniques are used to minimise the effects EMI. Sensitive parts of the circuit may be physically separated from sources of interference, the equipment may be enclosed in a sealed metal box, individual parts of the circuits may be shielded with metal foil, filters can be added to cables to filter out the noise,

EMC testing involves specialised test equipment and facilities. Testing must be carried out in an environment free from other sources of EMI. This usually means an anechoic chamber or a Faraday cage. Special wide range signal sources and sensitive receivers are needed to generate and measure the interference.

Some examples of EMC requirements are give in the section on Standards

Process audits
Conducting a process audit of the cell manufacturer's production facilities is further way of gaining confidence in the cells under consideration however this option is usually available only to major purchasers of high volume or high cost cells. Unless you are one of these you will have to rely on your friendly pack maker who possibly qualifies for special treatment.
The process audit involves verifying that the cell maker has appropriate quality systems in place and that these are being fully implemented at every stage of the manufacturing process. To be effective this task needs to be conducted by a team with specialist industry knowledge. Again this is a job best left to your pack maker who should have the necessary experience and credibility with the cell makers.

Inspection and Production Testing

The purpose of inspection production testing is to verify that the cells which have been purchased and the products built with them conform to agreed specifications. These tend to be short tests carried out on 100% of the throughput or on representative samples. The composition of the materials from which the components are made should not be overlooked. We have seen examples of unscrupulous suppliers plating connectors with a gold coloured alloy rather than the gold specified and using cheap plastics which buckle in the heat rather than the high quality plastics required.

Typical tests include both mechanical and electrical tests. The components are checked for dimensional accuracy and sample subassemblies are subject to weld strength testing of the interconnections. Electrical parameters measured include the internal impedance and the output voltage of the cell or battery pack with or without a load. The battery is also submitted to short duration charging and discharging pulses of about 2 milliseconds to check that the unit accepts and can deliver charge.

Battery packs are normally subjected to more comprehensive testing to ensure that the electronics are functioning correctly. The protection circuit is checked by applying a short circuit across the battery terminals for 1 or 2 seconds and checking that the current path is cut within the prescribed period and that the battery recovers afterwards. The output of the fuel gauge is checked and if the battery has built in memory, the data such as cell chemistry code, date and serial number are read out and recorded to permit traceability.

Charge conditioning or Formation
This is normally carried out by the cell manufacturer but in some circumstances it could be the responsibility of the battery pack assembler. In any case the cells must be tested to ensure that they are ready to deliver current.

Performance Monitoring

Performance monitoring is used to verify whether the cell is continuing to perform as required once it is in use in the application for which it was specified. These are individual tests specified by t he user.

There are no simple direct measurements, such as placing a voltmeter across the terminals, to determine the condition of the battery. The voltmeter reading may tell us something about the state of charge (with an enormous margin of error), but it cannot tell us how well the battery will deliver current when demanded.

Internal Resistance
It is necessary to know the internal resistance of the cell in order to calculate the Joule heat generation or I2R power loss in the cell, however a simple measurement with an ohmmeter is not possible because the current generated by the cell itself interferes with the measurement.

To determine the internal resistance, first it is necessary to measure the open circuit voltage of the cell. Then a load should be connected across the cell causing a current to flow. This will reduce the cell voltage due to the IR voltage drop across the cell which corresponds to the cell's internal resistance. The cell voltage should then be measured again when the current is flowing. The resistance is calculated by ohms law from the voltage difference between the two measurements and the current which is flowing through the cell.

Open Circuit Voltage OCV
Measuring a battery's open circuit voltage is not a reliable measure of its ability to deliver current. As a battery ages, its internal resistance builds up. This will reduce the battery's ability to accept and to hold charge, but the open circuit voltage will still appear normal despite the reduced capacity of the battery. Comparing the actual internal resistance with the resistance of a new battery will provide an indication of any deterioration in battery performance.

State Of Charge (SOC)
For many applications the user needs to know how much energy is left in a battery. The SOC is also a fundamental parameter which must be monitored and controlled in Battery Management Systems. The methods of estimating the SOC are explained in the section on State Of Charge.

State Of Health (SOH)
The State of Health is a measure of a battery's ability to deliver the specified current when called upon to do so. It is an important factor for monitoring battery performance once it has entered into use. This is treated briefly in the section below and more fully in the section on State Of Health.

Impedance and Conductance Testing
The discussion about the battery equivalent circuit in the section on Performance Characteristics shows that we can expect the battery impedance to increase with age.
Battery manufacturers have their own definitions and conventions for Impedance and Conductance based on the test method used. Though not strictly correct they serve their purpose.
The test method involves applying a small AC voltage "E" of known frequency and amplitude across the cell and measuring the in phase AC current "I" that flows in response to it.
The Impedance "Z " is calculated by Ohm's Law to be Z=E/I
The Conductance "C" is similarly calculated as C=I/E (the reciprocal of the impedance)

Note that the impedance increases as the battery deteriorates while the conductance decreases. Thus C correlates directly with the battery's ability to produce current, that is, its capacity, whereas Z gives an inverse correlation. The conductance of the cell therefore provides an indirect approximation to the State of Health of the cell. This measurement can be refined by taking other factors into account. These are outlined in the page about State of Health.
In addition to impedance and conductance these tests will obviously detect cell defects such as shorts, and open circuits.

These test methods can be used with different cell chemistries however different calibration factors must be built into the test equipment to take into account differences in the aging profiles of the different chemistries.

Impedance and conductance testing are reliable, safe, accurate, fast and they don't affect the battery performance. They can be carried out while the battery is in use or they can be used to continuously monitor the battery performance, avoiding the need for load testing or discharge testing.

DC measurements
Note that DC measurements do not recognise capacitance changes and therefore measurements of the internal resistance of the cell do not correlate so well with the SOH of the cell.

Using a conventional ohmmeter for measuring the resistance of the cables, contacts and inter-cell links is not satisfactory because the resistance is very low and the resistance of the instrument leads and the contacts causes significant errors. More accuracy can be achieved by using a Kelvin Bridge which separates the voltage measuring leads from the current source leads and thus avoids the error caused by the volt drop along the current source leads. See also charger voltage sensing.


Battery Analysers

Battery analysers are designed to provide an quick indication of the State of Health (SOH) of the battery. Some analysers also have the dual function of reconditioning the battery.
There are no industry standards for this equipment, mainly because there is no standard definition of State of Health. Each equipment manufacturer has their own favourite way defining and measuring it, from a simple conductance measurement to a weighted average of several measured parameters and the test equipment is designed to provide the corresponding answer. This should not be a problem if the same equipment is used consistently, however it does cause problems if equipment from different manufacturers is used to carry out the tests.

Failure Analysis

Cell failure analysis is best carried out by the cell manufacturers. Only they will have the detailed specifications of the cell mechanical and chemical components and it normally requires access to expensive analytical equipment such as electron microscopes and mass spectrometers which they should be expected to have. More information see Why Batteries Fail and Lithium Battery Failures